When a page feels sluggish, the first question is usually "what was the main thread doing?" The Long Animation Frames (LoAF) API has been the best field answer to that question for a while: it tells you which frames ran long and which scripts were responsible. What it has been less good at is separating JavaScript time from rendering time, and, within rendering, style recalculation from layout. Chrome 157, which entered beta on October 15, 2026, closes part of that gap.
According to the Chrome 157 release notes on Chrome Platform Status, the Performance category contains one item: LoAF gains styleDuration and forcedStyleDuration, "to distinguish style and layout time." Several entries on that page are marked as pending review, so treat the exact shape as something to confirm against the final stable release. The idea, however, has been public for a while: Microsoft's origin trial listing for "Long Animation Frames - separate style and layout durations" names four attributes: styleDuration, forcedStyleDuration, layoutDuration and forcedLayoutDuration, and describes the goal as a deeper understanding of CSS performance issues in the wild.
What LoAF already gives you
A quick refresher, based on Chrome's Long Animation Frames documentation. Each long-animation-frame entry carries a duration, a renderStart (when the rendering cycle begins, covering requestAnimationFrame callbacks, style and layout, and resize and intersection observer callbacks), a styleAndLayoutStart, a blockingDuration, and a scripts array describing scripts that ran longer than 5 ms. Each script entry has an invoker, an invokerType, source attribution, and a forcedStyleAndLayoutDuration: the time that script spent in forced style and layout.
That last field is the interesting precedent. It already tells you when a handler is thrashing layout. The new durations extend the same idea to a finer breakdown.
Forced versus non-forced: why the distinction matters
There are two very different ways style and layout work ends up inside a long frame.
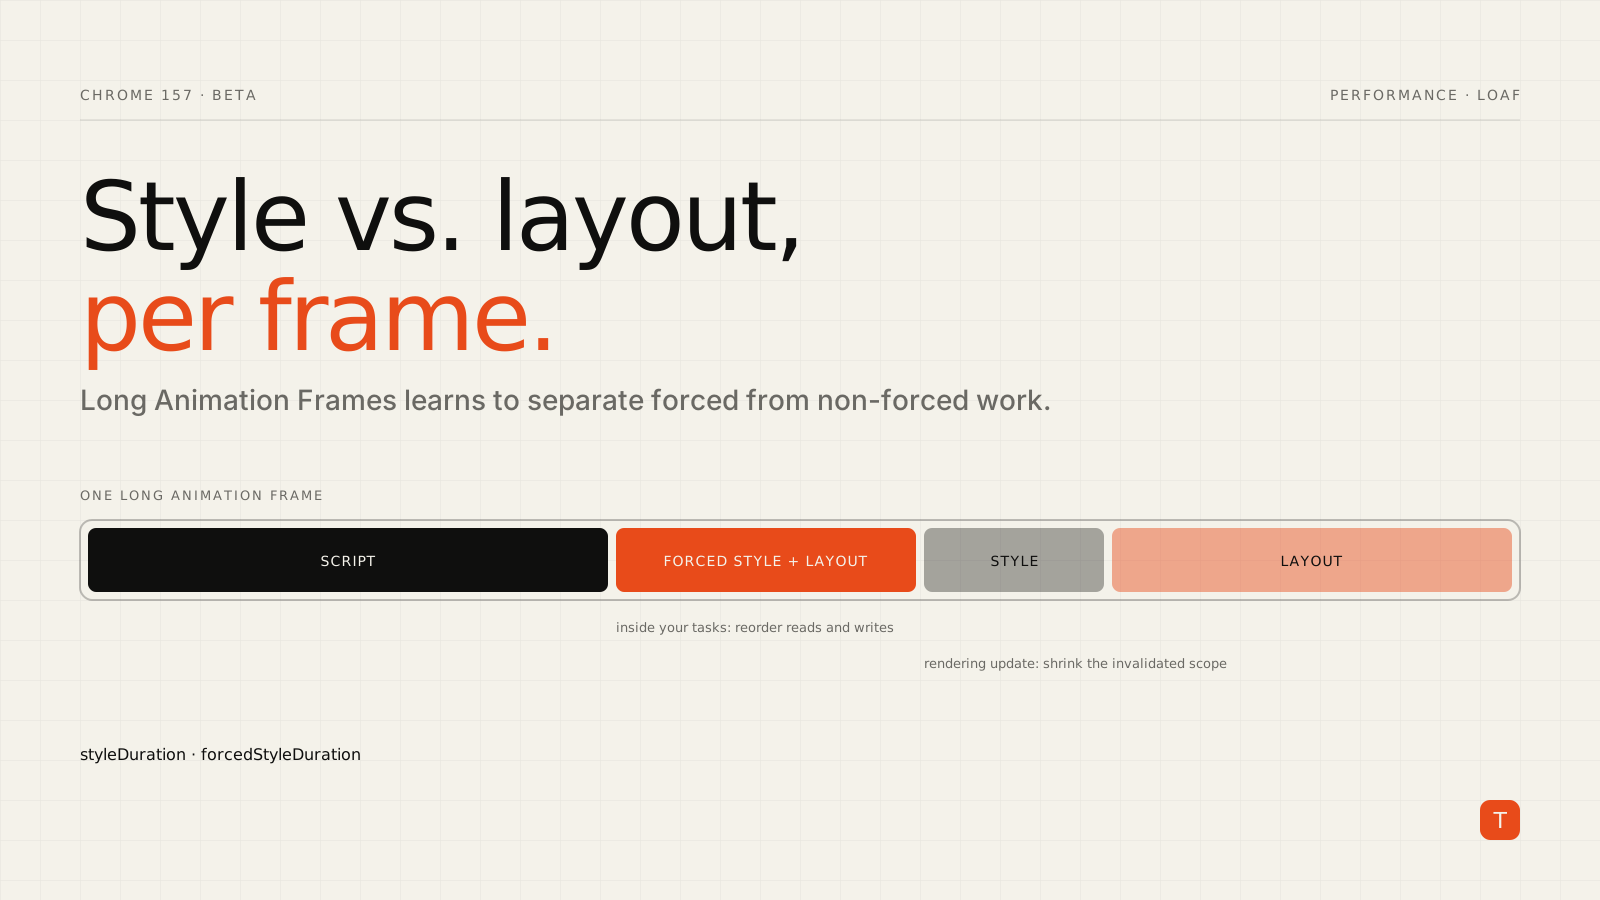
Forced style and layout happens inside your own tasks. A script writes to the DOM and then reads a layout-dependent property such as offsetHeight or getBoundingClientRect(), so the browser has to compute style and layout synchronously to answer. Do that in a loop and you get layout thrashing. Several forced passes can occur in a single frame, and the cost is attributable to your code.
Non-forced style and layout is the regular work of the rendering update itself: after your scripts finish, the browser recalculates what it needs to paint the frame. This cost is driven by how much of the document your changes invalidated, which is a function of your DOM size, selector complexity and how broadly you touched classes or custom properties.
These have different fixes. Forced work is solved by reordering reads and writes. Non-forced work is solved by shrinking the invalidated scope. Before this change, a long renderStart-to-end span told you something expensive happened in rendering, but not which of the two you were looking at.
A defensive collector you can ship today
Because the new fields are only just arriving in stable, write the collector so that it works with or without them and does not assume which object they live on:
const STYLE_FIELDS = [
  'styleDuration',
  'forcedStyleDuration',
  'layoutDuration',
  'forcedLayoutDuration',
];

function pick(obj) {
  const out = {};
  for (const key of STYLE_FIELDS) {
    if (typeof obj[key] === 'number') out[key] = Math.round(obj[key]);
  }
  return out;
}

const observer = new PerformanceObserver((list) => {
  for (const entry of list.getEntries()) {
    const payload = {
      duration: Math.round(entry.duration),
      blocking: Math.round(entry.blockingDuration),
      page: location.pathname,
      frame: pick(entry),
      scripts: entry.scripts.map((s) => ({
        url: s.sourceURL,
        invoker: s.invoker,
        duration: Math.round(s.duration),
        forcedStyleAndLayout: Math.round(s.forcedStyleAndLayoutDuration),
        ...pick(s),
      })),
    };
    navigator.sendBeacon('/rum/loaf', JSON.stringify(payload));
  }
});

observer.observe({ type: 'long-animation-frame', buffered: true });
Two practical notes. First, use an observer rather than performance.getEntriesByType(): Chrome's documentation points out that the performance timeline buffer is capped and drops newer entries once it fills. Second, keep the payload small and sample it. LoAF entries can be frequent on heavy pages, and you want a few percent of sessions, not every frame from every visitor.
How to read the numbers
Once data is flowing, group by page template and look at the relationship between fields rather than absolute values.
If forcedStyleAndLayoutDuration on a script is a large share of that script's duration, you have a read/write interleaving problem. The classic fix is to batch: read everything first, then write.
// Thrashes: each iteration forces layout
for (const el of items) {
  el.style.width = el.parentElement.offsetWidth / 2 + 'px';
}

// Batched: one layout, then all writes
const widths = items.map((el) => el.parentElement.offsetWidth / 2);
items.forEach((el, i) => { el.style.width = widths[i] + 'px'; });
If forced time is low but the frame's non-forced style duration is high, scripts are not the culprit. Look at what you invalidate: toggling a class on <body> that restyles the entire tree, deeply nested selectors, or updating a custom property near the root that thousands of elements consume. Scoping the change to the smallest subtree that needs it, or containing it with contain or content-visibility, reduces the work the browser must redo.
If neither is large and blockingDuration is still high, the time is in script execution or elsewhere, and the existing scripts attribution is where to dig.
Connecting this to INP
Interaction to Next Paint includes the time from an input until the next frame is presented, so a handler that triggers a long style and layout pass inflates it directly. LoAF is how most teams attribute INP regressions in the field. Having style and layout broken out means a regression report can say "this route's INP rose because non-forced style recalculation doubled after the redesign" rather than "something in rendering got slower." That is a much more actionable ticket.
Takeaways
- Treat the Chrome 157 fields as new but not yet universal. The release notes list them under Performance, but several entries on that page are pending review and MDN still flags the related script-level property as experimental and of limited availability. Feature-detect and collect them opportunistically.
- Ship a LoAF observer with sampling if you have not already. The data you collect today for scripts and
forcedStyleAndLayoutDurationis useful immediately, and the new fields slot in when browsers send them. - Use the forced/non-forced split to route work: reorder reads and writes for forced time, reduce invalidation scope for non-forced time.
- Pair field data with DevTools reproduction. LoAF tells you where the problem is in production; the Performance panel lets you confirm the fix locally.
Field-level breakdowns like this are what turn "our INP is poor" into a concrete list of components to fix. If you want help instrumenting real-user monitoring or working through a Core Web Vitals backlog, get in touch.