Most memory leaks in a web app are not dramatic. There is no forgotten global array or runaway interval. Instead, a large object stays alive because a small, innocent-looking function somewhere still holds a reference to the scope it was created in. These are some of the hardest leaks to explain, because the code that retains the memory never touches it.
The October 2026 DevTools release, covered in New in DevTools: November 2026 and shipped with Chrome 155 and 156, adds a tool aimed at exactly this case: detection of dead context fields in heap snapshots.
What a dead context field is
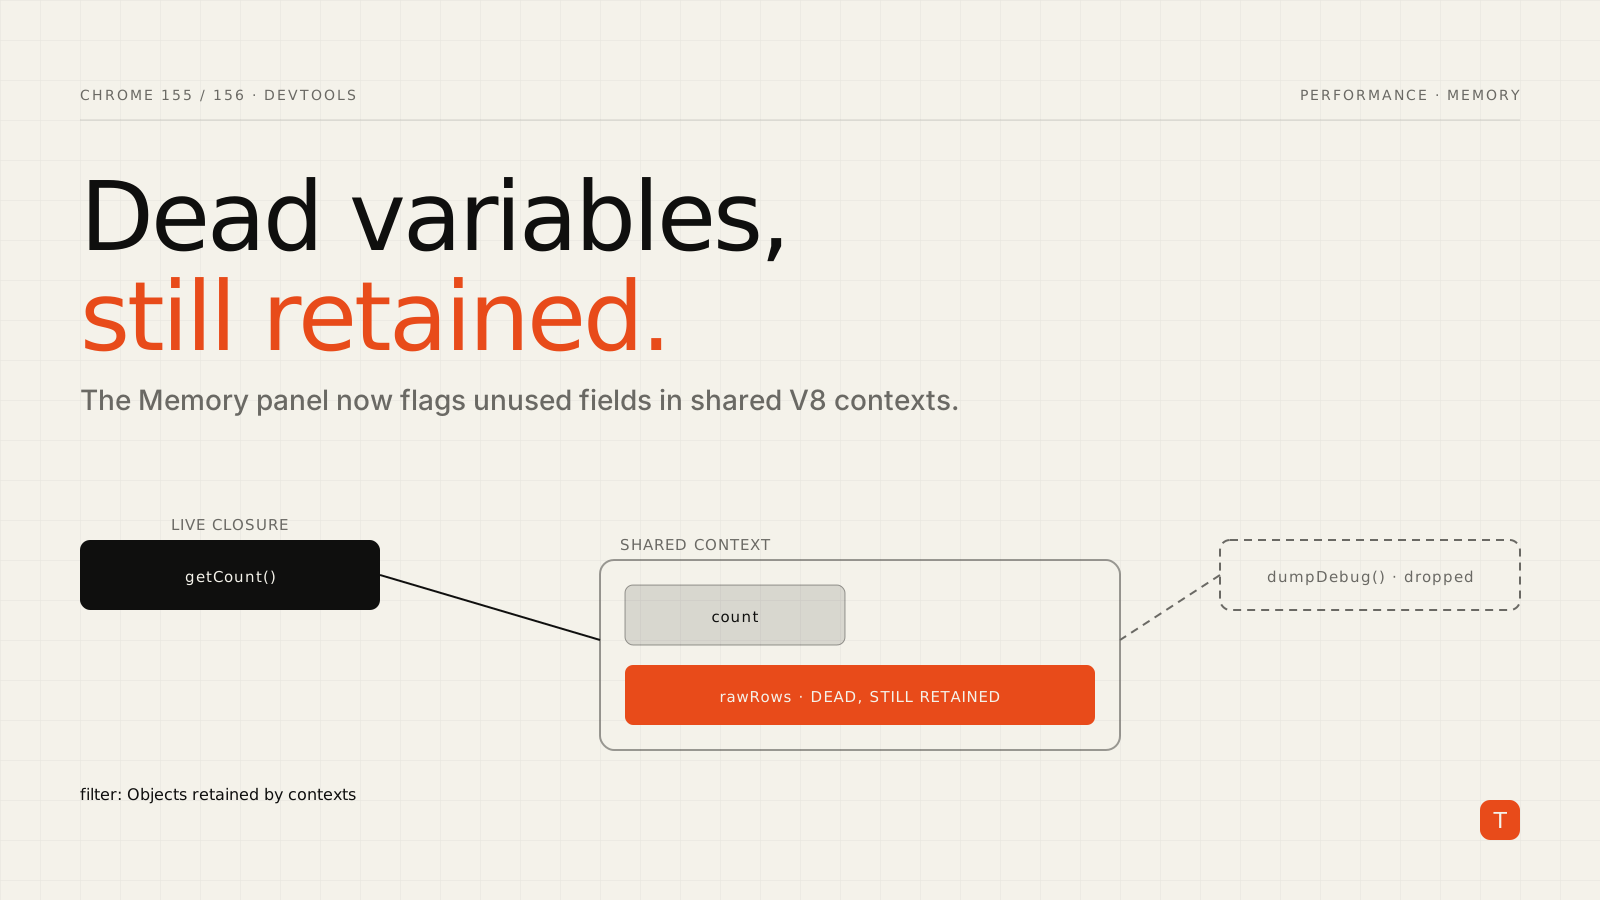
When JavaScript closures capture variables, V8 stores those variables in a context object on the heap. Closures created in the same scope generally share that context. That sharing is where the trouble starts: if one closure references a variable, the variable lives in the shared context, and every other closure from the same scope keeps the whole context alive, including variables that those other closures never read.
Chrome's write-up describes the result as unused closure variables that remain retained in V8 execution contexts. The new Memory panel feature reads V8 scope metadata embedded in the heap snapshot, links closures to their shared Context objects, and flags fields that long-lived sibling closures keep alive while no live closure accesses them. Results are sorted by memory impact, so the most expensive offenders come first.
A concrete example
Here is the shape of code that produces this leak. Treat it as an illustration of the pattern, not as output from the new tool.
function createReportWidget(rows) {
  // Large intermediate data used only during a debug session.
  const rawRows = rows.map((r) => ({ ...r, raw: JSON.stringify(r) }));
  const count = rows.length;

  // Short-lived: used once, then discarded by the caller.
  const dumpDebug = () => console.log(rawRows);

  // Long-lived: registered for the life of the page.
  const getCount = () => count;

  return { dumpDebug, getCount };
}

const widget = createReportWidget(loadTenThousandRows());
registerStatusBar(widget.getCount); // lives forever
widget.dumpDebug = null;            // the caller drops the debug helper
After the last line, nothing alive calls dumpDebug, and getCount only needs count. But rawRows was captured by dumpDebug, so it was allocated in the context shared by both closures. getCount keeps that context reachable, and the context keeps rawRows reachable. The variable is dead from the program's point of view and alive from the garbage collector's point of view. That is a dead context field.
How to find one
The workflow, based on the DevTools release notes and the standard heap snapshot documentation:
- Open DevTools, go to the Memory panel, choose Heap snapshot, and click Take snapshot after you have exercised the feature you suspect.
- Filter the snapshot by "Objects retained by contexts". This is the filter the DevTools release highlights for surfacing dead variables held by a shared V8 execution context.
- Review the flagged fields, which are ordered by memory impact, and start with the largest.
- Use the Retainers panel to confirm the chain. Selecting an object shows what points to it, and you can right-click a retainer and choose "Ignore this retainer" to see what else keeps the object alive without editing your code.
Two terms matter when you read the numbers. Shallow size is the memory held by the object itself, while retained size is what you would free by deleting it once nothing else references its dependents. A tiny context object can have a very large retained size, which is why this class of leak is easy to miss when you only scan for big objects.
How to fix it
There is no single fix, but three patterns cover most cases.
Split the scope. Move the long-lived closure into a function that only sees what it needs, so it no longer shares a context with the heavy variable.
function makeGetCount(count) {
  return () => count;
}

function createReportWidget(rows) {
  const rawRows = rows.map((r) => ({ ...r, raw: JSON.stringify(r) }));
  const dumpDebug = () => console.log(rawRows);
  return { dumpDebug, getCount: makeGetCount(rows.length) };
}
Now getCount closes over a context that holds only count.
Release explicitly. If restructuring is not practical, assign null to the heavy variable when you are done with it. This works only if the variable is declared with let, and only if every closure that needs it is finished first.
Avoid capturing large values at all. Pass data as arguments, compute the small derived value you need up front, and let the large object go out of scope with the function call.
Where this matters in practice
Dead context fields tend to appear in long-lived pages: dashboards, admin tools, single-page apps that stay open for hours, and anything that registers event listeners, observers, or subscriptions in a factory function. Memory growth in these apps shows up as sluggish interactions and, eventually, tab crashes on lower-end devices.
If you are already seeing memory climb across route changes, take snapshots before and after the same action, compare them, and then use the context filter on the later one. The new detection removes much of the guesswork about which closure to blame.
Related changes in the same release
The same DevTools release adds a few items worth a look if you work on performance. The Network panel now warns in the Early Hints headers section when a 103 response includes preload links while Disable cache is on, explaining why Chrome ignores those preloads. The Sensors panel gains a CPU Performance Tier control that overrides navigator.cpuPerformance. And the Performance panel keeps expanded nodes, selection, and scroll position in the Call tree and Bottom-up tabs when you switch panels.
Takeaways
- Closures created in the same scope can share one V8 context, so a variable only one of them uses may be kept alive by all of them.
- In Chrome 155 and 156, use the Memory panel's heap snapshot with the "Objects retained by contexts" filter to find dead context fields, sorted by memory impact.
- Confirm with the Retainers panel before changing code.
- Fix by splitting scopes, releasing references explicitly, or not capturing large values in long-lived closures.
- Add a before-and-after heap snapshot to your review checklist for any change that adds long-lived callbacks to a factory function.
Sources: New in DevTools: November 2026, Chrome for Developers; Heap snapshots, Chrome DevTools documentation.