Ad scripts are the part of a page most teams own the least and feel the most. They arrive from other origins, they change between page loads, and when Interaction to Next Paint or Largest Contentful Paint regresses, they are the first suspect and the hardest one to prove guilty. The October 2026 "New in DevTools" update, covering Chrome 153 and 154, adds something that helps directly: an Ads sub-panel in the Application panel.
This post walks through what the panel reports, how to fold it into a performance review, and where you still need other tools.
What the Ads panel shows
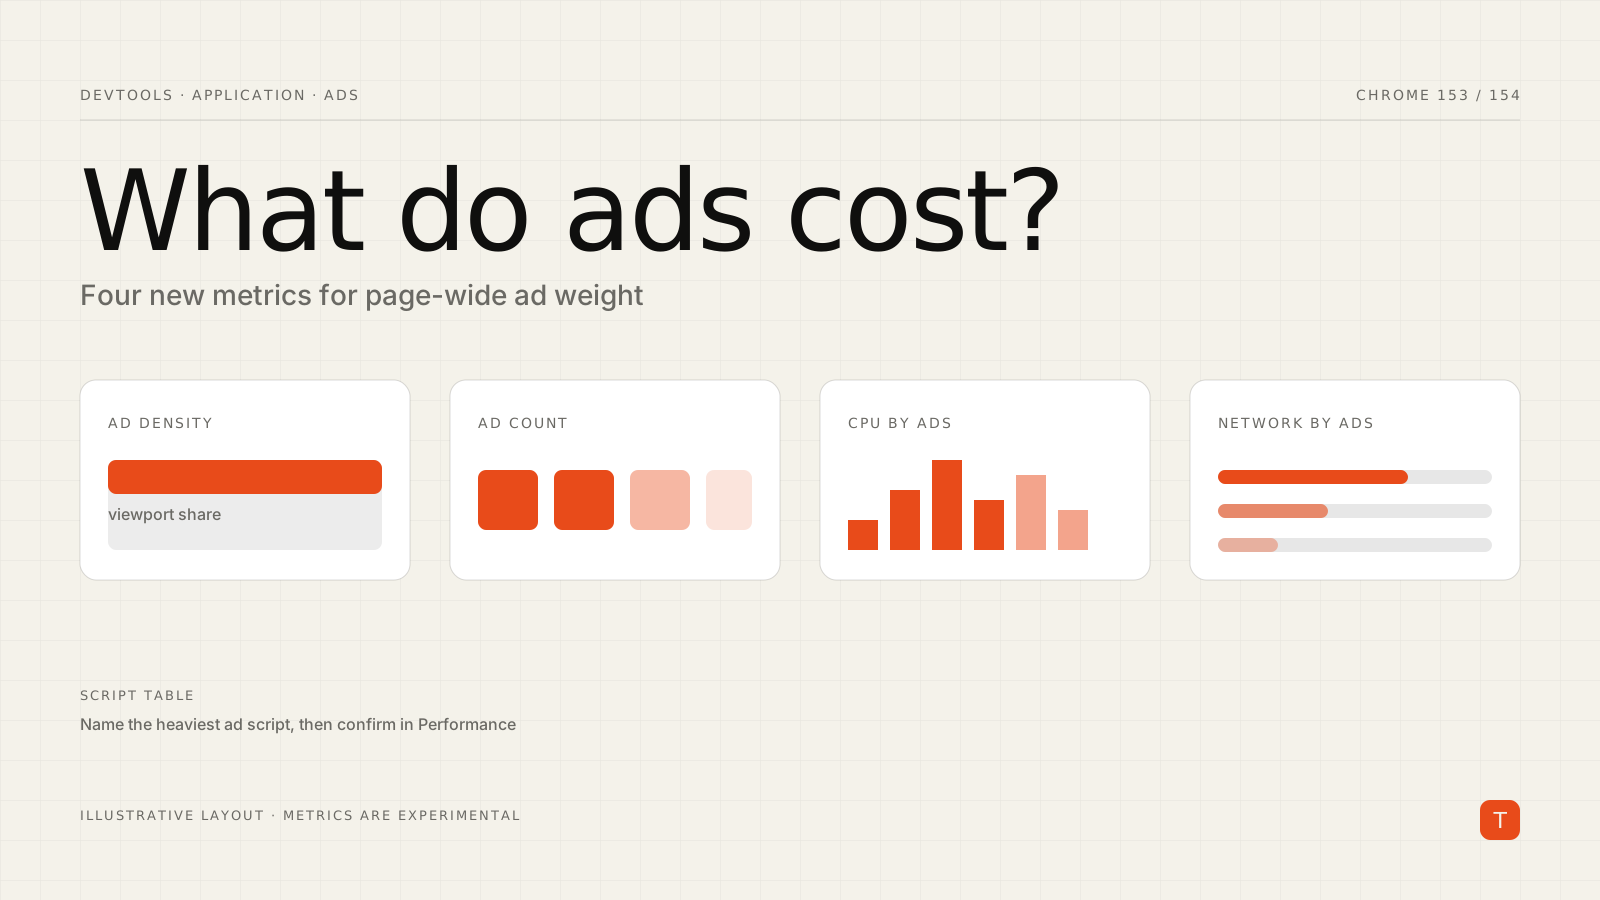
According to the Chrome team's announcement, the new sub-panel is "a centralized location to debug and optimize page-wide ad-related information." It contains:
- A dashboard for four new experimental metrics: viewport ad density, viewport ad count, total CPU usage by ads, and total network usage by ads
- A breakdown of CPU and network usage by ad elements
- A table of ad scripts in the main frame
- A toggle that highlights ads on the page
Notice what is new here. Before, you could filter the Network panel by domain and eyeball the Performance panel's bottom-up view, but you had to decide yourself which requests and tasks counted as "ads." The panel gives you a page-wide number for ad CPU and ad network cost, so a conversation about ad weight can start from a measurement instead of an opinion. The metrics are labeled experimental, so treat the exact values as directional and expect them to evolve. Chrome's ads documentation describes the new metrics in more detail.
A practical workflow
A repeatable check beats a one-off look. Here is a sequence that works for most content or e-commerce pages that carry advertising.
1. Establish a baseline with ads on
Open the page in a clean profile or incognito window so extensions do not skew results, open DevTools, go to Application, and select the Ads sub-panel. Reload and note the four headline numbers. Record them somewhere, even a spreadsheet, along with the page URL and date.
2. Use the highlight toggle for layout questions
Turn on the highlight toggle and scroll the page. This is the quickest way to see whether ad slots sit above the main content, how much of the first viewport they occupy, and whether ad density is something the design chose or something that accumulated. Viewport ad density is a design-level decision as much as an engineering one, and this view makes it easy to show a product owner.
3. Rank the ad scripts
Use the table of ad scripts to find the heaviest contributors. Often one or two scripts account for most of the cost, and that changes the conversation with an ad operations team from "ads are slow" to "this specific tag is responsible for most of the CPU time."
4. Cross-check with the Performance panel
The Ads panel tells you how much; the Performance panel tells you when and why. The same release adds full soft navigation support to Performance Insights, so if your site is a single-page app you can now analyze route transitions end to end rather than only the initial load. Record an interaction that feels sluggish, then look for long tasks that line up with ad script activity.
Attributing slow frames in the field
DevTools is a lab tool. To see whether ad scripts hurt real users, collect attribution in production. The Long Animation Frames API exposes which scripts contributed to a slow frame:
const observer = new PerformanceObserver((list) => {
  for (const frame of list.getEntries()) {
    if (frame.duration < 100) continue;

    for (const script of frame.scripts) {
      // Send to your analytics endpoint
      navigator.sendBeacon('/rum', JSON.stringify({
        type: 'loaf-script',
        frameDuration: Math.round(frame.duration),
        scriptDuration: Math.round(script.duration),
        source: script.sourceURL,
        invoker: script.invoker,
      }));
    }
  }
});

observer.observe({ type: 'long-animation-frame', buffered: true });
Group the beacons by source origin and you will see which third parties show up in slow frames for real users on real devices. Pair that with the lab numbers from the Ads panel and you have both a controlled measurement and a field confirmation. Note that Long Animation Frames is currently a Chromium feature, so the data covers Chrome-based browsers only.
Related updates in the same release
Two other changes in the October update are useful when you are chasing ad-related regressions:
- CPU performance override via the DevTools Protocol.
Emulation.setCPUPerformanceOverridelets you set a CPU performance tier programmatically, which helps when you script repeatable lab runs on a fast development machine and want results closer to a mid-range phone. - Memory panel heap snapshot tools. You can filter edges by minimum retained size, sort by retained size, and query objects directly by retained size or property name. If an ad-heavy page grows memory over a long session, this makes it faster to find what is holding on to it.
Turning measurements into decisions
Numbers only matter if they change something. A few actions teams commonly take once they can see ad cost clearly:
- Set a budget. Agree on a ceiling for ad CPU and ad network usage per page template, and check it during releases.
- Reserve space. If highlighting shows ad slots shifting content, give each slot a fixed or minimum height with
min-heightoraspect-ratioso late-loading creatives do not cause layout shifts. - Defer what you control. Load ad tags after your own critical rendering path, and keep ad initialization off the main thread's critical window where your ad stack allows it.
- Escalate with evidence. Bring the per-script table to the ad vendor or ad operations team. A named script with a measured cost is a ticket someone can act on.
- Re-measure after changes. Run the same Ads panel check after every ad stack change and log the results next to the previous baseline.
Limitations to keep in mind
The metrics are experimental, so do not wire hard pass/fail gates to them yet. The script table covers ad scripts in the main frame, so work happening inside cross-origin ad iframes may need the Performance and Network panels to investigate fully. And as with any lab measurement, results vary with ad auctions, geography, and consent state, so compare runs under similar conditions.
Takeaways
- Open Application, then the Ads sub-panel, and record ad density, ad count, CPU, and network numbers for your key templates.
- Use the highlight toggle to review ad placement with designers and product owners.
- Use the script table to name the heaviest ad scripts, then confirm in the Performance panel.
- Collect Long Animation Frames attribution in the field to see which third parties hurt real users.
- Treat the new metrics as directional while they are experimental, and re-measure after every ad stack change.
Source: New in DevTools - October 2026 on developer.chrome.com, and the Chrome ads documentation.